0. Introduction
Usually, a device records the sample data as a stream without any time information, along with the sample rate that was used for recording the data. For example assume that the raw data is:
I=20, D1, D2, D3, ..., DN
where I is the sample rate (or time interval between two recordings), and Di is the i-th depth value. How should we assign the timestamps Ti to each sample? Do we assign timestamp T0=0 or T1=20 to the first sample?
When there are events recorded in the datastream, there is an additional problem. For example assume that the raw data is:
I=20, D1, E, D2, D3, ..., DN
Does the event E belong to the sample D1 or D2?
Now let's have a look at how those device operate. I think it's reasonable to assume all devices are driven by an internal clock that awakes the device at regular time intervals to do some processing. Such as reading out its sensors (depth, temperature, tank pressure, etc), updating its decompression calculations and anything else it needs to do. Note that this internal wakeup interval is not necessary the same as the interval used for recording the sample data.
The be able to detect the start of a dive, the device will have to check its depth sensor and once the depth is above a certain threshold, it will switch into dive mode. The same happens when you reach the surface again at the end of the dive. If you are above the depth threshold for a certain amount of time, the device will exit dive mode. This explains why the recorded data usually starts and ends with a non-zero depth recording.
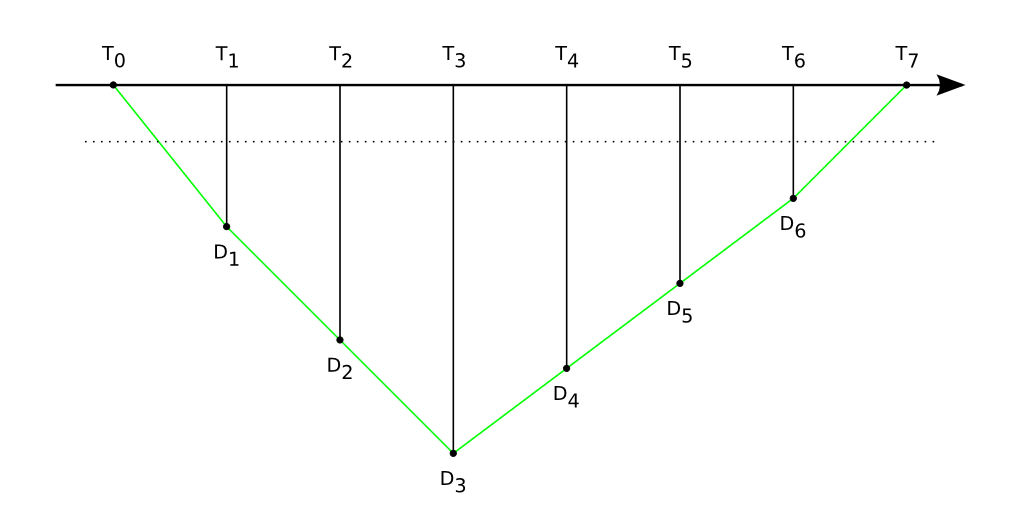
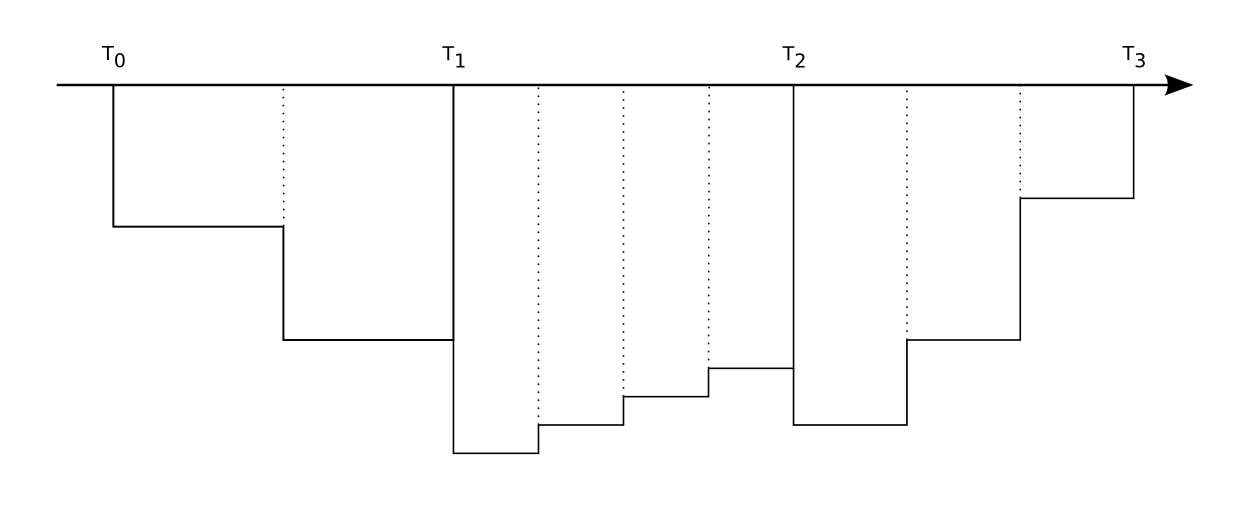
Armed with this knowledge, we'll look back at the time stamping problem. Assume you did a dive with the profile in the graph above, with a device that does wake-up/record at the timestamps Ti and a depth threshold indicated by the dashed line.
When you enter the water at T0, you are still below the depth threshold, and as far as the device is concerned, no dive is started until the next wakeup at T1. At this point, the first depth sample is recorded. But the real start of the dive was somewhere between T0 and T1, but we simply don't know the exact time. A similar thing happens when you leave the water at T7. Since you are below the depth threshold, the last recorded sample will be at T6, while the real end was somewhere between T6 and T7.
To complicate everything, the device can wakeup more often then it records a sample. For instance it can measure multiple times during an interval and record the average, minimum or maximum value. It also means the real start and end of the dive will be closer to T1 and T6 because the device will notice sooner.
The question is how are we going to represent all this?
1. Sampling methods
Most sample data (depth, temperature, pressure, etc) changes continuously, but is measured/recorded by the device at a number of discrete points in time. For the sampling method, there are basically two options.
1.1 Interval sampling
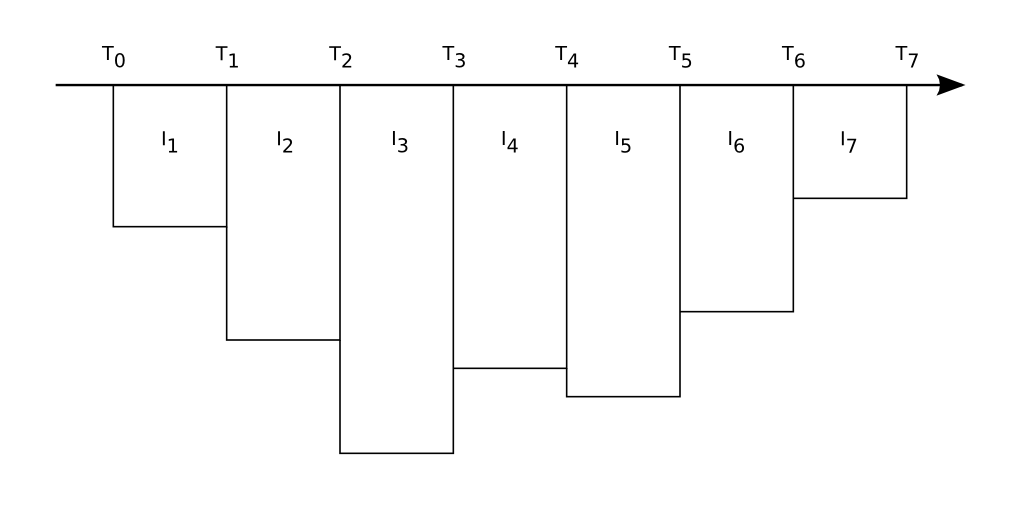
When using an interval based sampling method, the device records one or more values during a certain time interval, and records the min/max/avg value for that interval. That final value is assumed to apply to the entire interval. The resulting profile graph will look like a histogram.
I suspect that this is how most devices record their data, because the time between two measurements (for updating its decompression calculation) is likely much shorter than the user defined recording interval. When setting a 1 minute recording interval, I highly doubt the device will update its decompression only once a minute. I haven't checked all manuals, but at least the Suunto Vyper manual mentions it records the maximum depth within each interval.
1.2 Point sampling
When using a point based sampling method, the device records a single value whenever a certain amount of time has elapsed. Between two consecutive measurements, the value is assumed to vary linearly. The resulting profile graph will look like an x/y point plot, with line segments connecting the points.
I assume this is how everyone is drawing their profile graphs? Maybe with smooth lines instead of straight line segments, and a nice background gradient for a more visually attractive graph, but that doesn't matter here.
2. Issues
When trying to represent an interval based samples (as obtained from a device) with point based samples (for easy drawing), there are a number of options.
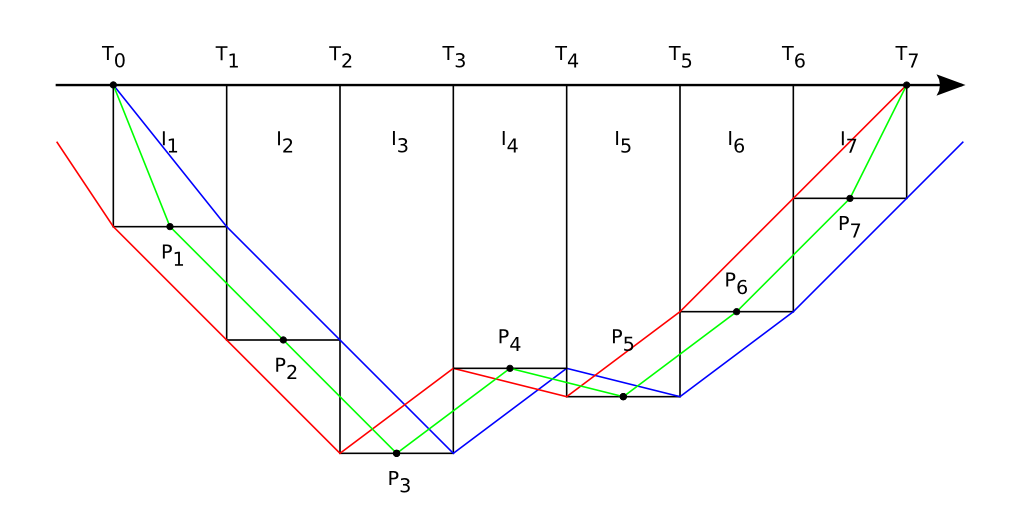
The first method is to take the midpoint of each interval, and connect those points with line segments (green line). This is probably the technically most correct method, because it provides the best approximation of the histogram. But it has the disadvantage that you can end up with non-integer time points (e.g. a 15s interval length would result in 7.5s).
The second method is to take either the end or the begin point of each interval (blue and red lines). I think this is what most applications are doing.
2.1 Endpoint samples
The first issue is related to the endpoint (or surface) samples at both ends of the profile. Not all devices store such samples, but inserting them when they are not present would have a number of advantages:
- Some devices only store the temperature and pressure at the begin and the end of the dive. Having the surface samples, would allow to attach this info to those surface samples.
- Certain file formats such as UDDF require them.
- Improved consistency.
But inserting them is not as straightforward as it may look. As you can see on the illustration, there is always one loose end (except for the midpoint method).
If you blindly insert an extra sample at end+interval, the total dive time will increase. If the interval is small, that's probably no big deal, but there are also older devices with larger intervals (e.g. 3 mins for the suunto solution). Internally, we could compensate the extra sample, but then the duration would be different with a manually calculated one.
If you insert the extra sample with a timestamp that is equal to that of the last non-surface sample, the timestamps are not unique anymore. No idea if that would be a problem. It could be if you attempt to calculate the interval length (it would become zero)?
An extra complication exists for devices that provide a sample with a non-zero depth at the start of the dive (time zero). Some Oceanic and Suunto devices appear to have such samples.
2.2 Variable sample rates
Both sampling methods can support a variable sample rate, where the time interval may change for each sample. In practice, there are only a few very specific cases where that actually happens:
2.3.1 A remainder field
The suunto solution (with its 3 minute sample rate) has a remainder field to indicate how many minutes there are after the last complete sample, but before the diver surfaced. So the last interval can be shorter or longer (depending on whether you add that time to the last sample or start a new sample).
2.3.2 Event based recording
Some Oceanics have a event based sample recording method, where a new value is recorded whenever the depth has changed a certain amount.
The tricky part here is that the device only records timestamps with a resolution of one minute, and thus there can be zero or more depth readings within the same minute. Obviously this were not all readings taken at the exact same time, but at different times where the seconds have been lost.
I think the most appropriate way to deal with this situation is to distribute all samples with an identical timestamp evenly inside that one minute. That would be identical to the idea of using a variable samplerate for every minute.
2.3.3 Pseudo event based recording
Uwatec Smarts have a pseudo event based recording method. They sample every 4 seconds, but they have a special sample type to "fast forward" a number of samples in time if nothing happened during that time.
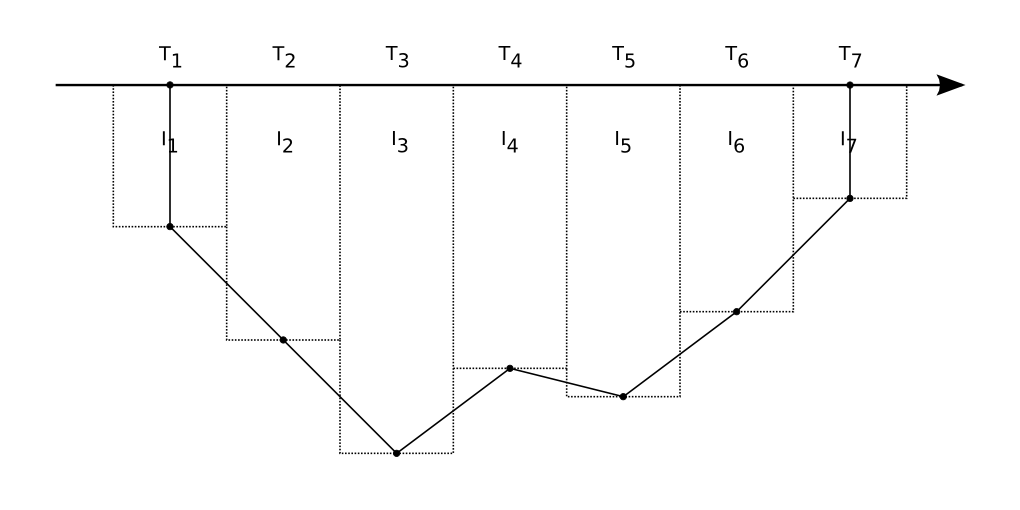
When merging multiple samples into one larger sample, as can be done in the Uwatec case, there is a new problem that is easily visualized in the next illustration:
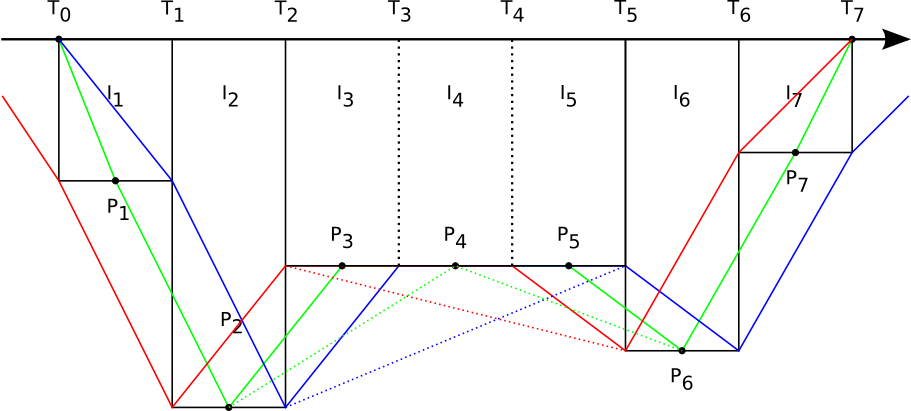
If samples 3, 4 and 5 are considered as one large samples, you'll end up with the dotted lines, while you actually wanted the solid lines.
Workaround: This problem can be avoided entirely by inserting the omitted samples again. The idea is to consider the Uwatec Smart dataformat as a compressed format, and thus the need to decompress it again.
2.3.4 Merged profiles (and freedive sessions)
When merging multiple profiles, the surface interval between the two parts is usually much wider than a single sample. When trying to visualize such a profile with a line graph, you'll always end up with an incorrect graph, regardless of which point you choose. The effect is illustrated in the graphic below.
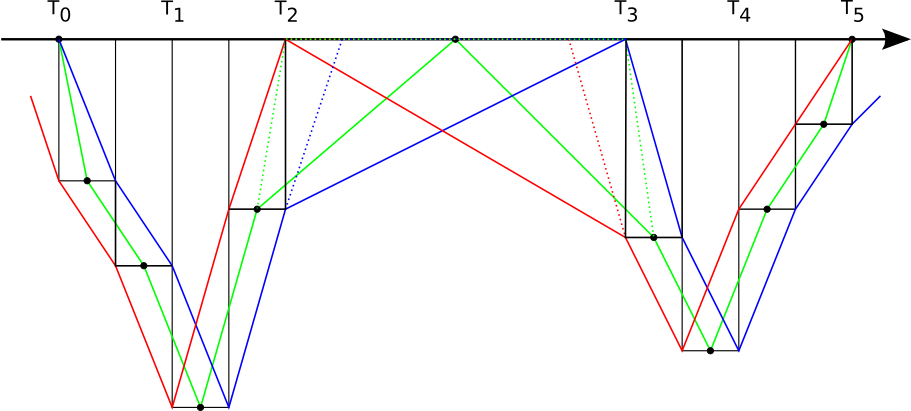
Mares devices in freedive mode do not record each individual freedive separately. Instead they record the entire freedive session as a single dive. Because such a freedive session consist of many freedives with a surface interval in between, this is equivalent with the idea of merged profiles.
2.3 Interpolation method
When sensor data is not provided for every single sample point, there are a number of options to fill in the missing data:
- Do not try to reconstruct the missing data. This might be the most appropriate method for devices such as the Suunto Vyper, that record certain data (e.g. temperature, pressure) only at a few discrete points (e.g. at the start and the end of the dive, and at maximum depth).
- Assume the data remains constant and copy the data from the previous sample. This is the most appropriate method for devices such as the Uwatec Smart, that do record data only when there was a change.
- Assume the data varies linear and interpolate the missing values. This is probably the most appropriate method for devices such as the Suunto D9, that do record certain data (e.g. temperature) only every X samples.
How are we going to handle this?
Workaround: Leave the interpolation entirely to the application, except for the Uwatec Smart decompression stage (e.g. applying the constant interpolation) as explained previously.